
|
| THE ELECTRONIC JOURNAL OF COMBINATORICS (ed. June 2005), DS #5. |
We follow Grünbaum [Gr75] in first defining a more general concept, an independent family. Let C = { C1, C2, ..., Cn } be a collection of simple closed curves drawn in the plane. The collection C is said to be an independent family if the region formed by the intersection of X1, X2, ..., Xn is nonempty, where each Xi is either int(Ci ) (the interior of Ci ) or is ext(Ci ) (the exterior of Ci ).
If, in addition, each such region is connected and there are only finitely many points of intersection between curves, then C is a Venn diagram, or an n-Venn diagram if we wish to emphasize the number of curves in the diagram. The condition that there are only a finite number of intersection points is usually assumed in the literature, but often not stated explicitly. It rules out segments of curves from intersecting.
Since each region is either inside or outside of a given curve, and there are n curves, there must be exactly 2n regions in a Venn diagram (including the exterior, empty region, which is outside of all curves). Note that some authors refer to diagrams with fewer than 2n regions as Venn diagrams, but they are more properly termed Euler diagrams, after the mathematician Leonard Euler. More on these important diagrams can be found on the page on Generalizations and Extensions. We refer to a region enclosed by exactly k curves as a k-region or k-set.

 On the left we show the most familiar of all Venn diagrams.
In this case n=3, the simple closed curves are all circles,
and in the leftmost diagram the 8 regions have been labelled with
the interiors that are included in each intersection.
The eighth region is the exterior region, corresponding to the empty set.
The colored diagram has all 1-sets colored yellow, all 2-sets red,
and the 3-set blue.
This diagram also occurs as a minimal projection of the
Borromean Rings.
On the left we show the most familiar of all Venn diagrams.
In this case n=3, the simple closed curves are all circles,
and in the leftmost diagram the 8 regions have been labelled with
the interiors that are included in each intersection.
The eighth region is the exterior region, corresponding to the empty set.
The colored diagram has all 1-sets colored yellow, all 2-sets red,
and the 3-set blue.
This diagram also occurs as a minimal projection of the
Borromean Rings.

|
On the left we show an example, for n=4,
of an independent family that is not
a Venn diagram.
Here the simple closed curves are each congruent triangles, which
are colored red, blue, green, and gold.
Note that the intersection of the interiors of the red and
blue triangles with the exteriors of the green and gold
triangles gives a disconnected region, the shaded region(s)
in the figure.
The figure below is a Venn diagram of 4 ellipses, originally found by Venn himself [Ve80]. See also a black-and-white version, and its Tutte embedding11 (these last two figures provided by Stuart Anderson). 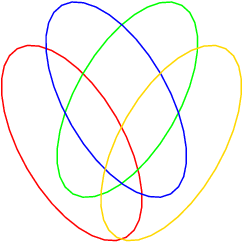
|
A simple Venn diagram is one in which no more than two curves intersect at a common point. Simple diagrams are in some sense the "nicest" as they are easiest to draw and understand. All of the figures on this page are simple, but we will see many examples on other pages of non-simple diagrams. Unless stated otherwise, we assume simple Venn diagrams.
Finally, we note that the 3-circle diagram shown above, and the 2-circle diagram for 2 sets, appear often in the context of proving simple logical arguments. Readers interested in the applications of Venn diagrams to logical arguments are referred to the excellent introductory article by Glassner [Gl], the book by Shin [Sh], and many standard logic textbooks.
 Venn's construction, outlined in his original paper
[Ve80], is best
explained by considering the figure to the right.
Start with the 3 circle diagram.
Curves are successively added, with the new curve tracing the
one last added and dividing each existing region in two.
In the figure they are added in the order blue (4), red (5),
and green (6).
It should be clear where the seventh curve would be drawn.
Venn's construction, outlined in his original paper
[Ve80], is best
explained by considering the figure to the right.
Start with the 3 circle diagram.
Curves are successively added, with the new curve tracing the
one last added and dividing each existing region in two.
In the figure they are added in the order blue (4), red (5),
and green (6).
It should be clear where the seventh curve would be drawn.
Anthony Edwards [Ed89a],
[Ed89b] developed another general
inductive construction that has several nice properties,
including some symmetry.
It is also best explained by means of an example; refer to
the diagram on the left.
For n=2 the diagram consists of two perpendicular lines.
(Strictly speaking we have to join the endpoints of these lines to make
them into simple closed curves.)
For n=3 a circle is added.
Successive curves will all be added that follow this circle,
weaving back and forth along the circle, again dividing each
region in two.
For n=4,5,6 the blue, red, and green curves are added,
in that order.
These diagrams have very attractive bipartite colourings as can be
seen below.
The reason for calling these colourings "bipartite" is explained in the
next section, Graphs Associated with Venn
Diagrams.

|
Every simple Venn diagram can be "woven" in to a link7; as one traverses any curve, the other curves alternately go over and under. The reader will find it an interesting exercise to prove that this is always possible for any collection of simple closed curves in the plane. For example, below we show the link that arises (after some smooth transformations in 3-space) from Venn's general construction for n = 4. This is clearly the same as the link that arises from Edwards' general construction for n = 4, although the constructions give different links for n > 4.

|
| THE ELECTRONIC JOURNAL OF COMBINATORICS (ed. June 2005), DS #5. |