
![]()
![]()
Authors: Bogna J. Smug ![]() ,
Monika Opalek
,
Monika Opalek ![]() ,
Maks Nęcki, Dominika Wloch-Salamon
,
Maks Nęcki, Dominika Wloch-Salamon ![]()
Shiny applications are particularly convenient for use in a variety of R microbiological data calculation and visualization packages. This is because they are interactive stand-alone tools which do not require any additional software. We invite to use our shiny web server:
https://microbialgrowth.shinyapps.io/lag_calulator/
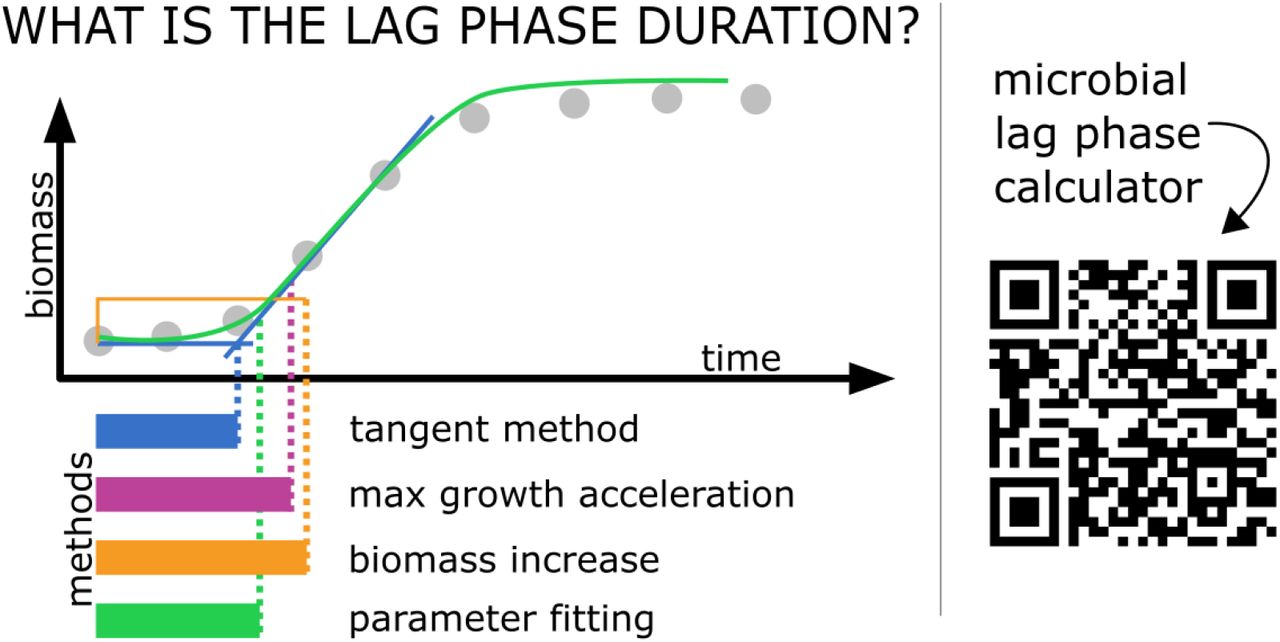
which allows to calculate microbial lag phase duration using popular methods and various data pre-processing techniques. The manual can be found here
For the developper’s use we invite to use either the local version of
the shiny app or the miLAG
package which provides a variety of functions that enable lag
calculations, and in particular the function: calc_lag.
miLAG aims to support a variety of of mathematical
methods calculating microbial lag duration. Currently supported methods
include: - tangent method, - max grow acceleration method, - biomass
increase method, - parameter fitting method,
You can install the latest development version of miLag
package from GitHub with these R commands:
if (!require("remotes"))
  install.packages("remotes")

remotes::install_github("https://github.com/bognabognabogna/microbial_lag_calulator", dependencies = TRUE, force = TRUE)
and the local vesrion of the shiny application by further running:
#install.packages("shiny")
#library(shiny)
#runApp('~/shiny_app/lag_calulator/app.R')The accepted file formats for input data are csv and txt. The input to the application should be in a file format with two columns: The first should describe the time (preferably in hours). The second column should describe the population size (preferably in CFU/ml). Be sure to select the decimal separator appropriately - this can be modified in one of the windows in the application. An example input dataset should look like the following:
time;biomass
1;4396571,976
1,5;3807332,496
2;4165206,611
2,5;5690282,713
3;7727252,94
3,5;19381419,82
4;13744788,86
4,5;18066675,15
5;23651017,71
5,5;29465323,75
6;28528881,12
6,5;29448677,51
7;29144257,31
7,5;32086465,47
8;29732262,17
8,5;29888494,33
9;30720558,23
9,5;31220300
10;32074919,83This example shows the use of miLAG with the example dataset;
library(miLAG)
available.methods = list("max growth acceleration",
                         "tangent",
                         "biomass increase",
                         "parameter fitting to a model")
parameters.default = get_def_pars()
Imagine this dataset:
time = seq(1,24,0.1)
biomass = if_else(time < 5, 10^5, if_else(time < 10, 10^5*(exp(0.05*(time - 5))), 10^5*(exp(0.05*(5)))))
example =
  tibble(
    time = time,
    biomass = biomass
  )
Which can be visualised as a growth curve:
library(ggplot2)
ggplot(example) + geom_line(aes(x=time, y = biomass)) +
xlab("Time") +
ylab("CFU")
And the lag can be calculated
get_lag(example, method = "max growth acceleration", pars = parameters.default)Additionally, the input growth curve can be visualised together with the lag duration calculation rationale:
lag.output = calc_lag(example, method = "max growth acceleration", pars = parameters.default)
plot_lag_fit(lag.output)
See vignette("miLAG") for a variety of additional
examples and more explanation of how it works.
cut_dataThis function causes the last biomass values to be cut off, depending
on the selected number of points we want to discard. A two-column
dataframe with “time” and “biomass” columns is used as the input dataset
to this function. The function returns a dataframe with two columns:
time and biomass. Example usage of the cut_data
function:
data = cut_data(example, cut_max_time)smooth_dataThis function smooths the growth curve data. It uses the 3SRS method
as the default argument of smooth_data. A two-column dataframe with
“time” and “biomass” columns is used as the input dataset to this
function. The function returns a dataframe with three columns: time,
smoothed biomass and curve id. Example usage of the
smooth_data function:
data = smooth_data(example, '3RS3R')We welcome feedback, suggestions, issues, and contributions! Contact
us at
bogna.smug@uj.edu.pl.
If you have found a bug, please file it here
with minimal code to reproduce the issue. Pull requests should be filed
against the dev
branch.
miLAG grew out of helper functions we wrote to make our
own lag phase calculation pipelines tidier. Over time it has expanded to
cover more use cases we have encountered, but we would love to make it
cover more! We also invite the scientific community to contribute to
further improvements.
We would like to thank Wolfram Moebius, Ryszard Korona, Joanna Rutkowska, Aleksandra Walczak, Hanna Tutaj and Adrian Piróg for the discussion and their valuable comments. The research was funded by the Priority Research Area BioS under the program Excellence Initiative – Research University at Jagiellonian University in Krakow to BJS; by the Polish National Agency of Academic Exchange, grant number PPN/PPO/2018/00021/U/00001 to BJS, the programme “Excellence Initiative–Research University” at the Jagiellonian University in Kraków, Poland (grant number U1U/W18/NO/28.07) to MO; the National Science Centre, Poland, the OPUS grant to D.W.-S. (grant number 2017/25/B/NZ8/01035); the Biology Department research subsidies (grant number N18/DBS/000019 to MO and DWS).
miLAGSmug, B. J., Opalek, M., Necki, M., & Wloch-Salamon, D. (2024). Microbial lag calculator: A shiny-based application and an R package for calculating the duration of microbial lag phase. Methods in Ecology and Evolution, 15, 301–307. DOI: 10.1111/2041-210X.14269.
miLAG has been developed using the Dplyr package in R (R Core Team 2021). Please note the authors take no responsibility for the results. Calculating lags is tricky and the result may not always have a strict biological interpretation.