novelqualcodes: Visualise the Path to a Stopping Point
in Qualitative Interviews ================ Kam Wong & Desi Quintans.
August 05, 2025.
This document (briefly) demonstrates how to use the novelqualcodes package to visualise the novelty and richness of semi-structured interviews over time.
novelqualcodes is a package aimed at qualitative researchers doing semi-structured interviews using the ‘framework’ method. Its main focus is to provide a transparent solution to reporting when refinements were made to questions during the interview process, and how that informs the researchers’ decision to stop interviews (the stopping point). Its secondary focus is to allow researchers to visualise the novelty and richness of interviews as they are coded so that it can be part of the decision-making process regarding the stopping point.
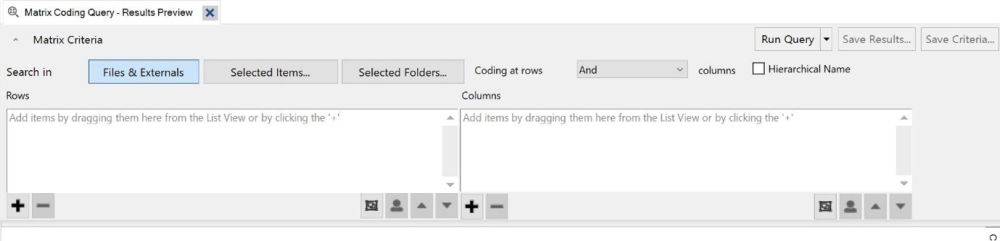
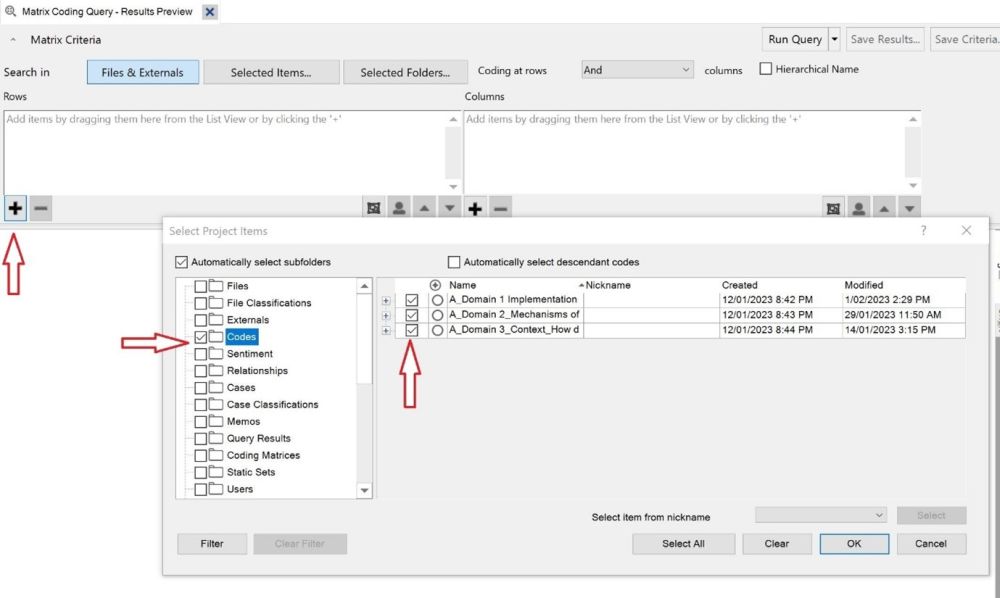
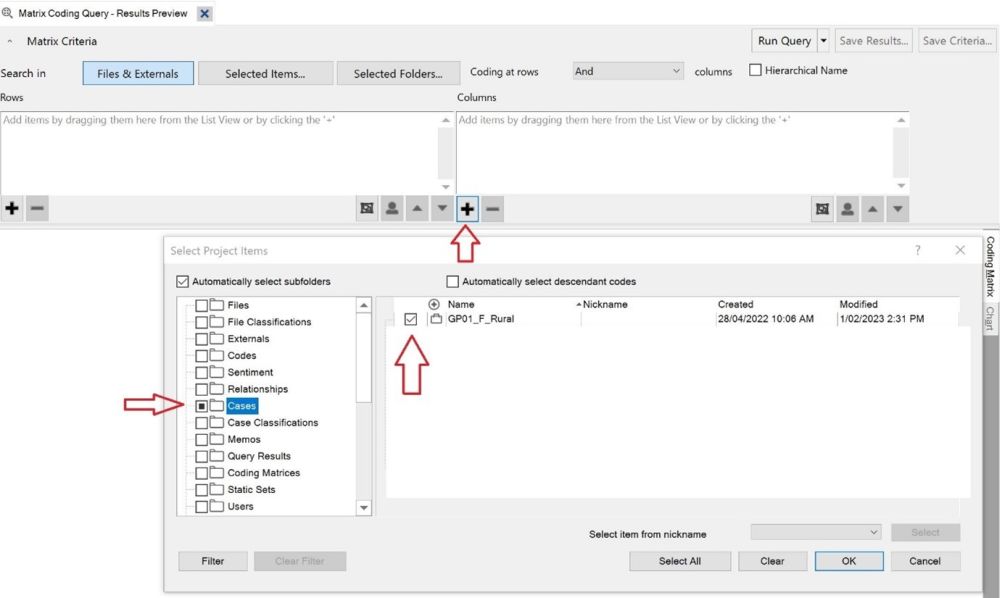
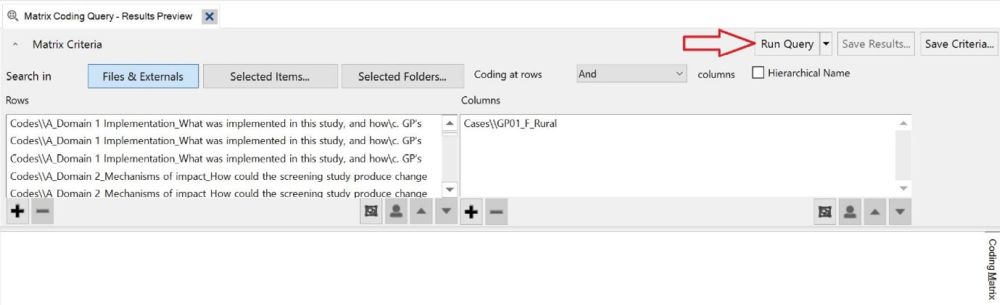
novelqualcodes does this by importing ‘coding matrices’ that are exported from NVivo’s Matrix Coding Query tool and tracking the trends of novel and duplicate codes across interviews. Briefly:
novelqualcodes gets information about refinements by importing a spreadsheet of field notes where you have recorded when refinements were made, what was done, and why it was done. Code trends and refinements are displayed together in publication-ready plots.
You can read more about the methodology of this package in:
Wong, K. C., Trankle, S. A., Quintans, D., Nguyen, T. N., Usherwood, T., & Chow, C. K. (2023). A Systematic Approach to Improving the Transparency of Interview Refinements and Data Sufficiency in Semi-Structured Interviews: An Illustration Using the Mass Atrial Fibrillation Screening Study. International Journal of Qualitative Methods, 22. https://doi.org/10.1177/16094069231220773
To run this package, you need to have the R statistical programming language installed. You can download it from https://cran.r-project.org; pick Download R for {your platform} and follow the links to download an installer, and then run the installer.
R comes with a simple editor called RGui.exe,
located in the installation directory. If you want something a little
easier to use that has more features, you can download and install
RStudio from https://posit.co/download/rstudio-desktop/.
Either way, start your chosen editor and you’ll be greeted with the R console. Basic information about how to use R is outside the scope of this guided tour; ample resources exist on the internet.
You will probably want to install the package from CRAN in the standard way:
install.packages("novelqualcodes")Or advanced users may want to install the actively-developed and up-to-date version from GitHub:
install.packages("remotes")
remotes::install_github("DesiQuintans/novelqualcodes")
You only need to install the package once; you don’t need to re-install the package if you’ve already installed it previously.
Right now, the package is installed on your computer but has not been called up for use. To do so, run:
library(novelqualcodes)novelqualcodes needs two kinds of input files from you: field notes and coding matrices.
This package accepts an Excel spreadsheet where you’ve recorded the refinements you’ve made to the interview process as you ran the study.
You can get a template of this spreadsheet by running the function:
create_field_notes_template("C:/path/to/save/this/to")Or by creating a spreadsheet in Excel with these column names and saving it in Excel (.XLSX) format:
interview_num is the upcoming interview number where
these refinements will take effect. At the time of writing, this is the
only column that is used by the package; the rest is for your
record-keeping.refinement_type is free text where you can describe the
kind of refinement you made, e.g. “add” or “rephrase” or “remove”.refinement is the actual text that has been
changed.reason describes the rationale behind the
refinement.other is for additional information you may want to
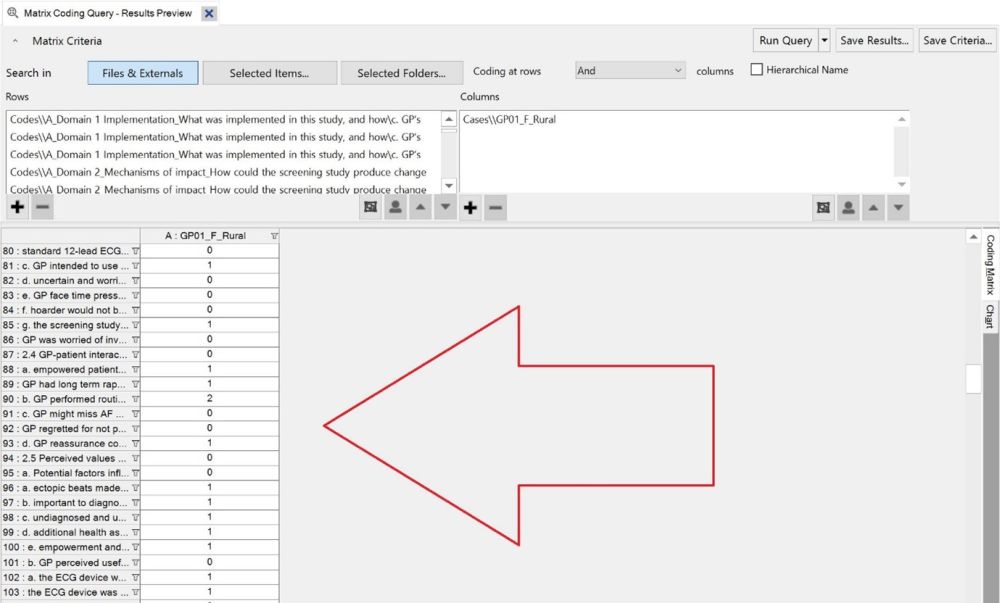
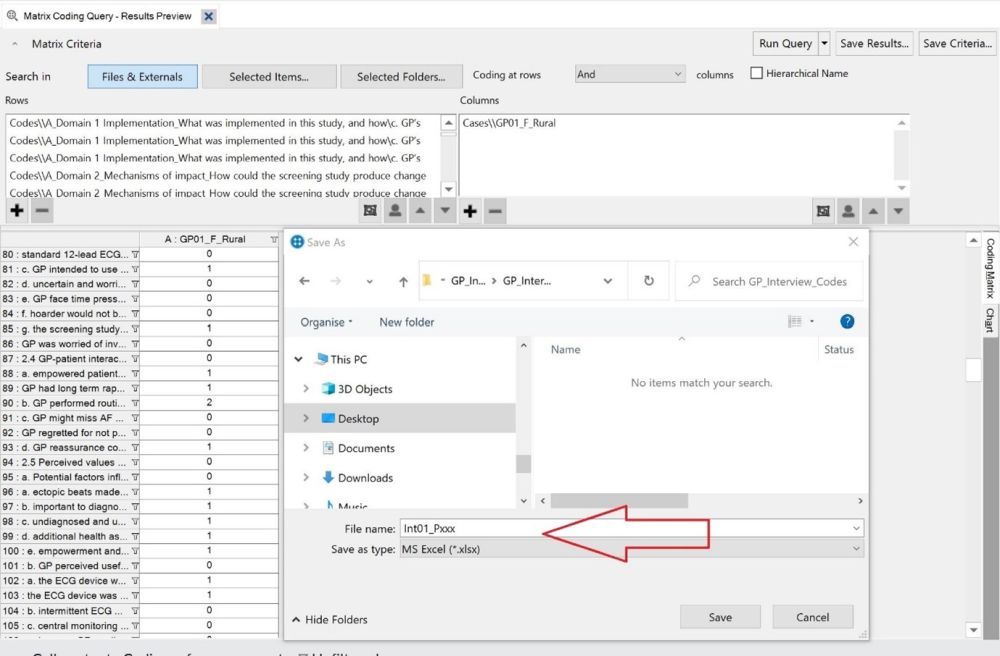
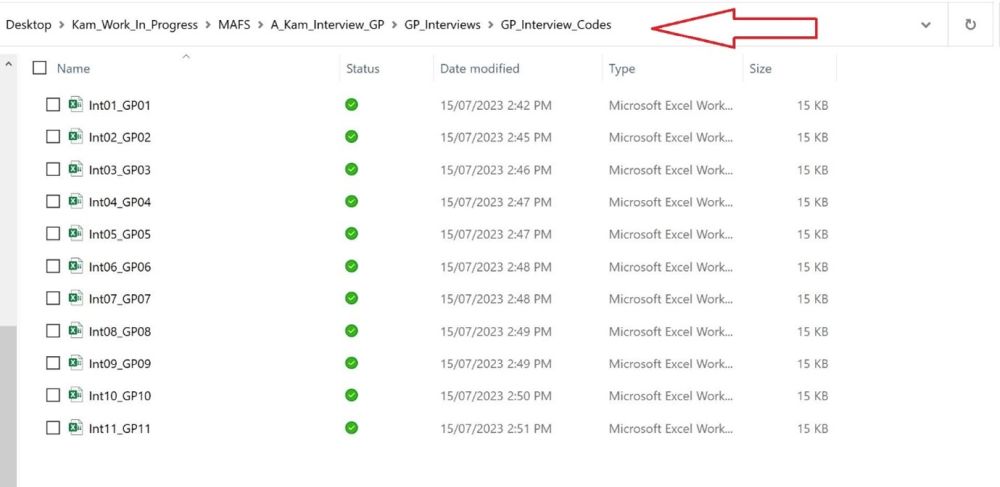
include.For our purposes, a coding matrix is an Excel spreadsheet where each row is a unique code, and each column shows how many times that code was mentioned in one interview. NVivo’s Matrix Coding Query tool can produce spreadsheets in the correct format, which we detail below.
Int006_P12 for the 6th
interview you conducted in the study, belonging to participant ID
12.2023-07-14 1355 P56 for an
interview you conducted on 2023-07-14 at 13:55, with participant ID
56.
Imagine that you are interested in public perceptions of insects. You’ve done 15 one-on-one interviews, you’ve made a few refinements, and you want to see how things are going. You have exported coding matrices for the 15 interviews from NVivo and put them into C:/insect_study/matrices/. You also have a field notes spreadsheet, located at C:/insect_study/records/refinements.xlsx. So your file structure looks like this:
C:/
----insect_study/
    +---matrices/
    |       Int01_ID112.xlsx
    |       Int02_ID18.xlsx
    |       Int03_ID14.xlsx
    |       Int04_ID72.xlsx
    |       Int05_ID33.xlsx
    |       Int06_ID32.xlsx
    |       Int07_ID77.xlsx
    |       Int08_ID85.xlsx
    |       Int09_ID17.xlsx
    |       Int10_ID12.xlsx
    |       Int11_ID21.xlsx
    |       Int12_ID31.xlsx
    |       Int13_ID54.xlsx
    |       Int14_ID121.xlsx
    |       Int15_ID731.xlsx
    |
    +---records/
            refinements.xlsx
Your refinements spreadsheet looks like this:
interview_num   refinement_type refinement          reason                  other
6               add             Can you tell...     Understand publi...
9               add             Why don't yo...     Get participants...
13              add             Is that how ...     feel about most ...
And your matrices look generally like this (note that it is fine to have zeroes in this matrix; they will be removed automatically):
                                                           A : Int14_ID121
1 : Doesn't often think about insects                                    0
2 : Insects are economically important                                   0
3 : Insects are agriculturally important                                 0
4 : Insects have pharmaceutical benefit                                  0
5 : Insects may be a future food source                                  0
6 : Insects are beautiful                                                1
7 : Insects are ecologically important                                   2
8 : Insects are endangered by human activities                           3
9 : Humans have a responsibility towards the environment                 3
10 : Positively responds to insects                                      0
11 : Talked about insect diversity                                       0
12 : Insects are entertaining                                            0
13 : Mentions killing insects                                            0
14 : Associates some insects with uncleanliness                          0
15 : Cites symbolism associated with insects                             0
16 : Does not like insects                                               0
17 : Sees insects as pests                                               0
18 : Sees only some insects as pests 0As detailed above in the section Installing novelqualcodes, we’ll start R and install the package if we haven’t done that yet.
Now we’ll load the package to make it ready to use:
library(novelqualcodes)First, let’s import the field notes and name it
my_refinements for later use:
my_refinements <- import_field_notes(path = "C:/insect_study/records/refinements.xlsx")Field notes are optional; if you do not have any field notes, then you can skip importing them.
Second, we can import all of the interviews in the matrices/
folder and name it nvivo_matrices:
nvivo_matrices <- import_coding_matrices(path = "C:/insect_study/matrices")

#> ( 1 / 15) Reading Int01_ID731.xlsx
#> ( 2 / 15) Reading Int02_ID121.xlsx
#> ( 3 / 15) Reading Int03_ID54.xlsx
#> ( 4 / 15) Reading Int04_ID31.xlsx
#> ( 5 / 15) Reading Int05_ID33.xlsx
#> ( 6 / 15) Reading Int06_ID12.xlsx
#> ( 7 / 15) Reading Int07_ID17.xlsx
#> ( 8 / 15) Reading Int08_ID85.xlsx
#> ( 9 / 15) Reading Int09_ID77.xlsx
#> (10 / 15) Reading Int10_ID32.xlsx
#> (11 / 15) Reading Int11_ID21.xlsx
#> (12 / 15) Reading Int12_ID72.xlsx
#> (13 / 15) Reading Int13_ID14.xlsx
#> (14 / 15) Reading Int14_ID18.xlsx
#> (15 / 15) Reading Int15_ID112.xlsx

#> 15 files were read.
Important note:
import_coding_matrices() imports any and
all Excel spreadsheets that it finds in the folder. This is why
you should keep your field notes and any other Excel spreadsheets in a
different place to avoid errors!
With the coding matrices imported, novelqualcodes now has
enough information to score novel and duplicate codes. Let’s do that now
and name the result code_results for later use:
code_results <- score_codes(nvivo_matrices)Looking at the result, we get a count of how many codes were
mentioned in each interview (n_codes), how many of those
were not mentioned in previous interviews (n_novel), how
many were previously mentioned (n_duplicate), and the
proportion and cumulative sums of codes.
print(code_results)
#>    itvw_seq n_codes n_duplicate n_novel prop_duplicate prop_novel cumsum_novel
#> 1         1       5           0       5      0.0000000  1.0000000            5
#> 2         2       4           0       4      0.0000000  1.0000000            9
#> 3         3       4           1       3      0.2500000  0.7500000           12
#> 4         4       2           1       1      0.5000000  0.5000000           13
#> 5         5       4           3       1      0.7500000  0.2500000           14
#> 6         6       3           2       1      0.6666667  0.3333333           15
#> 7         7       4           4       0      1.0000000  0.0000000           15
#> 8         8       3           3       0      1.0000000  0.0000000           15
#> 9         9       4           4       0      1.0000000  0.0000000           15
#> 10       10       2           2       0      1.0000000  0.0000000           15
#> 11       11       3           3       0      1.0000000  0.0000000           15
#> 12       12       3           3       0      1.0000000  0.0000000           15
#> 13       13       4           4       0      1.0000000  0.0000000           15
#> 14       14       4           4       0      1.0000000  0.0000000           15
#> 15 15 3 3 0 1.0000000 0.0000000 15In the most basic sense, the ongoing generation of novel codes shows that new information is being generated in the study. By showing novel codes in context with any refinements to the questions, it shows how that trend may have been affected by those refinements, and whether novel code generation is plateauing.
plot_novelty(score_df = code_results, refinements = my_refinements)
For this (very small and brief) example dataset, we can see that the three refinements we made before interviews 6, 9, and 13 did not generate any new information in subsequent interviews.
In a real-world situation this might suggest that a) our refinements were not properly targeted, or b) we have generated enough information and it might be time to stop interviews. However, this chart alone should not be used to decide on a stopping point because it does not show the richness (i.e. detail, broadness) of individual interviews, which is the job of our next plot.
If you did not import any field notes in Step 1, then you can run this function without any refinements:
plot_novelty(score_df = code_results)
Or if you know when you made refinements but don’t want to make a field notes file, you can provide the interview numbers directly:
plot_novelty(score_df = code_results, refinements = c(4, 8, 10))
If we want to save the most recent plot to a 10 x 5 cm image for use in a paper, we can run:
save_last_plot(filename = "C:/insect_study/plots/novelty.png",
               size = "10 x 5 cm", dpi = 300)
As a best practice, your figure caption should remind the reader of how many participants were present in each interview.
In a real semi-structured interview scenario, some interviews will touch on many different topics while others will be quite brief; we call this ‘richness’.
plot_richness(score_df = code_results, refinements = my_refinements)
Refinements are marked with stars at each bar. Comparing this richness plot to the previous novelty plot, we see that each interview mentions a similar number of codes (3 or 4 on average) and that none of the interviews after refinements produced any novel codes. This means that our lack of novel codes is probably not caused by an unlucky string of low-richness interviews, and supports the idea that our refinements are not properly targeted.
Again, if you did not import any field notes in Step 1 then you can run this function without any refinements:
plot_richness(score_df = code_results)
Or if you know when you made refinements but don’t want to make a field notes file, you can provide the interview numbers directly:
plot_richness(score_df = code_results, refinements = c(4, 8, 10))
R’s shortcut for help is ?{topic}. Try running
these in the Console if you want to know more about the functions we’ve
just used:
?novelqualcodes

?import_field_notes
?import_coding_matrices
?score_codes
?plot_novelty
?plot_richnessWe hope that this package is helpful to your research efforts. If you encounter any bugs or issues with it, please file an Issue at https://github.com/DesiQuintans/novelqualcodes/issues.